Runtime visibility built for 5G Core and Open RAN.
On the nodes where AMF, SMF, UPF, CU/DU, RIC, and Kubernetes workloads actually execute, Linux runtime activity and telecom protocol behavior become NF inventory, protocol state, attack chain detection, SLO visibility, investigation context, and service impact evidence.
From kernel events to telecom context.
Most tools see logs, metrics, or isolated packets. Process execution, sockets, files, privileges, namespaces, Kubernetes context, and telecom protocol activity are connected with the actual behavior of 5G Core and Open RAN systems.
- 01Capture. Start with the Linux activity behind the network function.
Process execution, sockets, files, privileges, namespaces, Kubernetes context, and protocol activity are captured directly from the node. The evidence does not depend on logs, declared inventory, or manually labeled network functions.
- 02Decode. Translate raw runtime signals into telecom context.
AMF, SMF, UPF, PCF, NRF, CU/DU, near-RT RIC, and other telecom roles are classified from behavior, ports, peers, protocols, process names, and runtime evidence.
- 03Explain. Turn isolated events into telecom evidence.
Node behavior, protocol state, peer relationships, tunnel activity, availability, process lineage, fleet correlation, and attack chain evidence are correlated so teams can understand what changed and why it matters.
Raw Linux activity becomes telecom evidence.
Logs and application telemetry are not the starting point. Kernel hooks, userspace probes, security decision points, and protocol capture connect a process, socket, file, namespace, pod, protocol message, peer, and network function role into one evidence record.
- 01System call intercepts
kernel function interceptAttached to over 40 kernel functions including network connections, process launches, and file operations. Fires on every call, capturing process context, socket state, and return values without modifying kernel code.
- 02Application-layer probes
userspace function interceptAttached to application libraries to observe service traffic from inside the process. Detects exposed service calls, unexpected peer behavior, and protocol use that violates the expected 3GPP or Open RAN boundary.
- 03Security policy hooks
kernel security policy interceptIntercept connection attempts and kernel operations at Linux security policy decision points. Used to detect unauthorized network connections from network function processes and unexpected access to security-sensitive kernel maps.
- 04Protocol packet capture
monitoring interface captureZero-copy capture on the management interface decodes 5G signaling (NGAP), session control (PFCP), user-plane tunneling (GTP-U), Open RAN control (E2AP), and legacy signaling frames. No kernel modification required.
Every 5G and O-RAN protocol decoded at the wire level.
3GPP and O-RAN protocol traffic is decoded directly from raw socket captures and kernel hook events. Each interface is decoded from its wire format. The table below shows what is captured per protocol and what attack surface it exposes.
| Protocol | Transport | What is decoded | Attack surface |
|---|---|---|---|
| NGAP | SCTP/38412 | The signaling protocol between radio nodes and the 5G core. Device attach, session setup, security negotiation, and context release procedures are decoded from the wire format. | Decode error bursts indicate fuzzing or protocol probing. Device security capability downgrade during security negotiation forces weaker encryption (NDSS 2019). |
| PFCP | UDP/8805 | The session control protocol between the session manager and user-plane function. Session setup, modification, deletion, and heartbeat messages are tracked per association. | A user-plane node initiating session setup (a session-manager role) signals role impersonation. Heartbeat failure within a 5-minute window signals a silent outage or session hijack pre-staging. |
| GTP-U | UDP/2152 | The user-plane tunnel protocol carrying subscriber traffic between radio nodes and the user-plane function. Each tunnel identifier is tracked with source IP, byte counters, and last-seen timestamp. | Signaling protocol traffic injected inside user-plane tunnels crosses the 5G architecture boundary - a published attack vector (TU Berlin, ACM CCS 2025). Tunnel floods exceeding 500 active identifiers per peer exhaust state tables and degrade service. |
| E2AP | SCTP/36421 | The Open RAN control interface between radio nodes and the near-real-time RAN Intelligent Controller. RIC subscriptions and performance indications are tracked per peer. | A connection to a previously unseen RIC address indicates rogue RIC insertion. A connection from a public internet address is an unconditional critical alert. A core function process binding the E2 port violates Open RAN architecture separation. |
| O1 (NETCONF/gNMI) | TCP/830, 6513, 9339 | The Open RAN management interface used by the Service Management and Orchestration layer to configure radio nodes. Management peer connections are monitored per node. | A management controller IP change after the baseline window indicates a man-in-the-middle or controller substitution. A management connection from a public internet address is an unconditional critical finding. |
| SBI / HTTP/2 | TCP/29500-29599, 7777 | Service-Based Architecture interfaces between 5G core NFs. Each endpoint is classified by NF role and service-call behavior is tracked between core functions. | OAuth2 token reuse across NF identities (token issued to AMF reused by SMF process). High-frequency HTTP/2 calls from a single NF suggest credential stuffing or reconnaissance. Plaintext SBI sessions expose control-plane traffic that should remain protected. |
| F1AP / E1AP / XnAP | SCTP/38472, 38462, 38422 | RAN split and inter-node signaling between CU, DU, CU-UP, CU-CP, and neighboring radio nodes. These interfaces expose radio-side topology, peer direction, and role boundaries. | Unexpected peers, public endpoints, or a core-side process binding radio split interfaces expose architecture drift and possible control-plane insertion on the RAN side. |
| Diameter / RADIUS / SIP | TCP/SCTP/3868, UDP/1812-1813, TCP/UDP/5060-5061 | Legacy telecom and IMS protocols used across mixed 4G and 5G environments. These flows are mapped to Diameter nodes, RADIUS servers, IMS nodes, and supporting telecom processes. | Credential abuse, unexpected authentication peers, IMS exposure, or signaling from the wrong process family can reveal lateral movement through legacy control surfaces. |
| NAS5G / M3UA / IKEv2 | Decoded from signaling context and UDP/SCTP transport | Subscriber signaling, SIGTRAN transport, and secure tunnel negotiation metadata. Protocol signals are linked back to process ownership, peer identity, and network function role. | Security negotiation anomalies, SIGTRAN exposure, and unexpected tunnel negotiation behavior become searchable evidence instead of disconnected packet artifacts. |
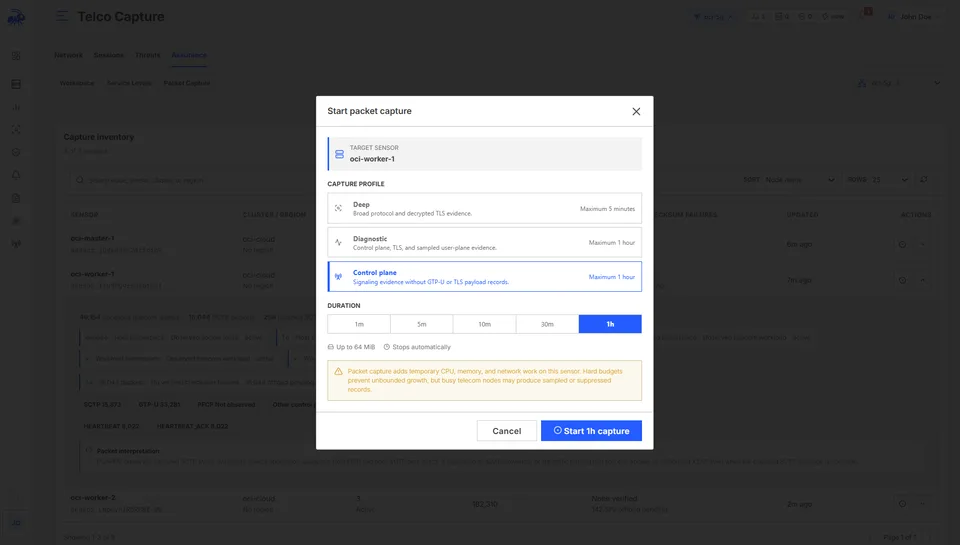
What happens after decoding. Runtime correlation that packets alone cannot provide.
Protocol parsing is only the first step. Decoded telecom traffic is connected with process ownership, NF role, Kubernetes context, session state, tunnel state, visibility gaps, and service impact so the evidence explains how the network behaved.
- 01Process identity
Runtime owner behind each telecom event
A protocol event is tied back to the process that produced it, its executable path, ancestry, namespace, pod, listening socket, and declared or inferred network function role. This is what separates a packet trace from runtime evidence.
- 02Role inference
Network functions classified from behavior
AMF, SMF, UPF, NRF, PCF, CU, DU, RIC, Diameter, RADIUS, SIP, and SIGTRAN roles are inferred from port ownership, transport use, peer direction, process behavior, and repeated observation across heartbeat cycles.
- 03State tracking
Session and tunnel lifecycle reconstructed
PFCP sessions, SEIDs, PDRs, FARs, URRs, GTP-U TEIDs, SCTP associations, and SBI calls are tracked over time. A restart, peer change, or tunnel burst can be investigated as one telecom timeline instead of separate host and packet events.
- 04Cloud native NFs
Kubernetes context attached to telecom behavior
Pod name, namespace, workload type, image digest, container ID, network namespace, and runtime posture are attached to telecom events so a CNF is not reduced to an anonymous container.
- 05Visibility gaps
Kernel bypass becomes an explicit finding
When user-plane traffic may bypass normal kernel paths through DPDK, VFIO, SR-IOV, UIO, or AF_XDP, the visibility gap is reported instead of silently implying that no GTP-U activity exists.
- 06Service impact
Security findings connected to availability
Restart bursts, heartbeat loss, protocol error rates, PFCP peer loss, NGAP failure rates, CPU pressure, memory pressure, and MTTR are connected to the affected network function role and service path.
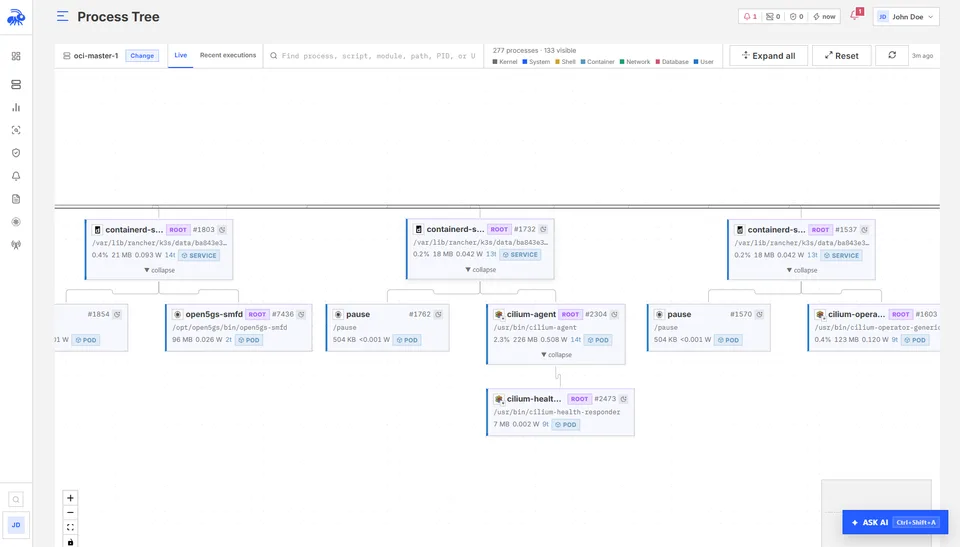
Network function availability is a security signal, not just an operational one.
A mobility function that restarts unexpectedly or a user-plane function that goes silent without a proper session teardown are security-relevant conditions. Per-function availability is tracked continuously against carrier-grade targets, with a minimum 5-minute observation window before any breach alert fires. Mean time to recovery is tracked across the last 10 restart events per function role.
| Network functions | SLO target | Classification |
|---|---|---|
| Session manager · User-plane · Mobility · Legacy core | 99.999 % (5-nines) | Session-critical path |
| Service registry · Authentication · Subscriber data | 99.99 % (4-nines) | Service registry |
| Policy · Exposure · Slicing · Radio · RAN controller | 99.9 % (3-nines) | Policy and Open RAN control |
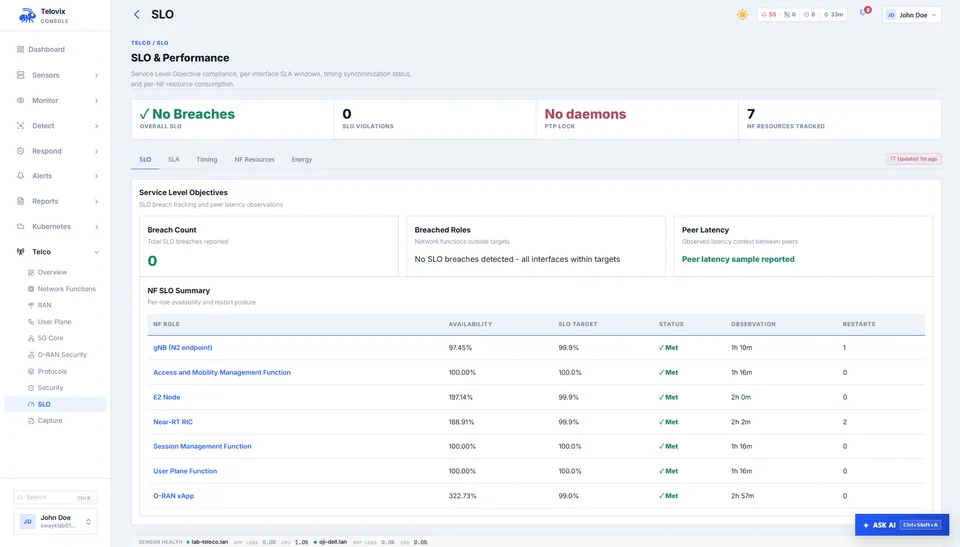
Every runtime signal becomes telecom investigation context.
Node inventory, role classification, protocol state, availability, attack chains, process lineage, behavioral fingerprints, shell sessions, and fleet correlation are connected per node and across the fleet. The result is not a loose event stream. It is evidence that explains how a telecom system behaved.
- 01
Protocol state timeline
Protocol activity is tracked as it changes over time: new SCTP associations, PFCP sessions, GTP-U tunnel identifiers, SBI calls, RIC subscriptions, and management peers. The timeline stays tied to the node, process, role, and peer that produced the evidence.
- 02
Node inventory and role classification
Network function roles are inferred from socket binding behavior, not process names. More than 20 function types are recognized, including mobility, session, user-plane, service registry, and Open RAN controllers. Classification stabilizes after two heartbeat cycles. A rogue process binding a known signaling port without the expected process ancestry triggers an immediate alert.
- 03
Investigation path
A suspicious binary can be traced through its parent process, children, network destinations, file activity, runtime baseline, shell sessions, and matching behavior on other nodes. That turns a single alert into an investigation path.
- 04
Runtime inspector
Current process state, top processes, system activity, network connections, red flags, listening services, containers, live feed, and protocol capture downloads give investigators a direct path from a telecom finding to host-level evidence.
Bring telecom-aware eBPF security to your runtime.
Telovix connects Linux kernel activity with 5G Core, Open RAN, Kubernetes workloads, protocol behavior, network function roles, and service availability so teams can understand their telecom infrastructure as it actually runs.